
I came across an interesting article today called “Why I Will Never, Ever Hire A “Social Media Expert” featured on Business Insider by Peter Shankman. In addition to being quite hilarious; it also covers the serious subject of current social media and how it can get in the way of what organizations NEED to do – deliver customer services and products people really want to buy.
Peter brings up a great point about the use of social media stating that at the end of the day a company’s success is not based alone on Facebook page likes or Twitter posts but is really about a simple basic driver - “It’s about generating revenue through solid marketing and stellar customer service, just like it’s been since the beginning of time.”
While social media outlets can create buzz, they should not be the only thing in your marketing toolkit as they do not make up for the basic marketing principals. As Peter states, “Do you know your audience? Have you reached out to them? I’m not talking about “tweeting at them.” I’m talking about actually reaching out. Asking them what you can do better, or asking those who haven’t been around in a while what you can do to get them back. It’s not about 10 percent off coupons or “contests for the next follower.”
The question is: How do you marry the latest buzz creating social media with direct customer interaction, innovation, and market research?
The answer is: icanmakeitbetter
I know this may seem like a cheesy plug for my own company (which it sort of is), but this article and this type of discussion is one of the main reasons we created icanmakeitbetter. While social media is a great tool, customers want to be heard and feel their feedback is shaping the products and services offered to them. We created icanmakeitbetter as a solution to do just this.
Please check out the platform and see how Dell and City of Austin are using social media to innovate, engage and actually do more of what works and less of what doesn’t. And if you have any questions, comments or ideas, I would love to hear from you!!
Showing posts with label market research. Show all posts
Showing posts with label market research. Show all posts
Friday, February 17, 2012
Friday, December 10, 2010
A Year in Review – Google Style
What a whirlwind of a year 2010 has been… in world events, in life and in work. And what better way to reflect on the year than to utilize the largest search engine Google to see a snapshot of the biggest events and searched terms of the year both globally and by country.
Google recently released Zeitgeist 2010: How the world searched. Here, you can find animated graphing using HTML5 (the latest and greatest in coding), which shows an aggregation of the terms that people all around the globe searched throughout 2010. Take a second to look at the search stars that have fallen and risen over the past year.
One of my favorite parts of this press release is the 2010 in Review video below. It shows a great recap some of the year’s biggest struggles, achievements, tragedies and milestones.
From myself and Sentient Services, we hope everyone has a wonderful holiday season. We cannot wait to see what 2011 will bring. Enjoy!
Friday, September 17, 2010
Design Thinking Applied To New iPad App
I came across this good, quick read on design thinking and applying it to launching a new business - in this case the iPad app Pulse from Alphonso Labs. You can read it here. In a nutshell here are the 5 steps:
1)Empathize: Research and understand the end-user - their needs, pains and usage scenarios.
2)Define: Focus on a core niche and then research that niche to define the why and how.
3)Ideate: Brainstorm sessions and innovation.
4)Create Prototype: These can be rough and even Post-It notes. But create something to narrow and code from.
5)Test: Usability test in the real world.
I would add a 6th one here which is to get Steve Jobs to present your app at the launch of iPad...which happened for Pulse. The result of good design or luck? Probably both, but you won't get lucky with bad design!
Monday, August 30, 2010
Lessons from Hawaii
At the end of June through the beginning of July, I took advantage of Sentient’s sabbatical benefit and took off to Hawaii for two weeks in the great outdoors. Unplugging for a full two weeks was a little bit of a challenge – I went through email withdrawal for the first couple of days. Once I did unplug, I was able to regain some perspective outside of my computer and smartphone.
Lesson #1: You have to get dirty to find the best views.
On Maui, we drove the road to Hana and saw LOTS of waterfalls. By far the most fun we had at one was in Pua’a Ka’a State Park. However NOT at the lower falls that you just stroll to on the park’s walkway; instead, the upper falls aboe that one.
Our guidebook, Maui Revealed by Andrew Doughty (which we highly recommend), clued us in:

There were at least 3 different times where I wanted to turn back – crossing the viaduct was one of them.

But being the only person swimming in the waterfall’s pool was definitely worth all the work.

Takeaway: Don’t be content with the status quo – find new trails in your work. From a research perspective, this could mean:
We also visited Mount Haleakala, the dormant volcano on Maui. Going up the 10,023 feet, I saw terrain and vegetation that reminded me of the alpine climate I have seen in the Colorado Rocky Mountain National Park. However, there were some plants, like the silversword, that I had never seen before. We were also lucky enough to see one that was blooming – something that they only do once in their lifespan of 50 years before dying.

And then there was the crater. This was terrain that I had never seen before, yet my brain still tried to relate it to something – namely what I imagine the terrain of Mars to look like.

Takeaway: When presenting something new, make it relevant. For example, relate new research findings to things that your audience might be familiar with – previous research, industry news, etc.
Lesson #3: You’re more interesting when you’re moving.
Starting to wonder if I spent any time in the ocean? Well yes, we went on a snorkel trip to Molokini. We saw all sorts of coral and fish.


On the way back to Maui, some dolphins started swimming around our boat. The captain stopped and the dolphins came to check us out. They played a bit, and then started swimming away. When the boat started moving again, the dolphins were immediately back, in front of the bow, and racing the boat – we were much more interesting when we were moving.

Takeaway: MOVE on your findings. At Sentient, we are always customizing and finding creative and actionable ways to interpret and present research that allows our clients to:
Lesson #1: You have to get dirty to find the best views.
On Maui, we drove the road to Hana and saw LOTS of waterfalls. By far the most fun we had at one was in Pua’a Ka’a State Park. However NOT at the lower falls that you just stroll to on the park’s walkway; instead, the upper falls aboe that one.
 |
| Lower Falls |
 |
| Upper Falls |
“There’s an awkward trail on the right of the upper falls. It first leads to a short path to the top of the falls, but if you go past it for 5-10 squishy minutes (it’s usually muddy), there’s a much heavier untapped falls and pool just above the diversion ditch that’s taking much of the lower falls’ water. When the trail gets to the elevated waterway (viaduct), you have to walk along it (which those afraid of heights will hate), then across. Only 100 more feet upstream is your prize.”Awkward, squishy and muddy are all understatements – the whole trail was practically a slip-n-slide. At one point my hiking shoes were completely submerged in mud. These were new shoes when I left for Hawaii, and after this hike, they looked like this.

There were at least 3 different times where I wanted to turn back – crossing the viaduct was one of them.

But being the only person swimming in the waterfall’s pool was definitely worth all the work.

Takeaway: Don’t be content with the status quo – find new trails in your work. From a research perspective, this could mean:
- Using a new technique to understand the desirability of a design described in the paper Measuring Desirability: New Methods for Evaluating Desirability in a Usability Lab Setting (WORD DOC) by Joey Benedeck and Trish Miner of Microsoft
- Trying a new platform from 20|20 Research with a mobile population that lets you reach respondents via text message
- Reading this month’s edition of Quirks to learn more about social media research (PDF)
We also visited Mount Haleakala, the dormant volcano on Maui. Going up the 10,023 feet, I saw terrain and vegetation that reminded me of the alpine climate I have seen in the Colorado Rocky Mountain National Park. However, there were some plants, like the silversword, that I had never seen before. We were also lucky enough to see one that was blooming – something that they only do once in their lifespan of 50 years before dying.

And then there was the crater. This was terrain that I had never seen before, yet my brain still tried to relate it to something – namely what I imagine the terrain of Mars to look like.

Takeaway: When presenting something new, make it relevant. For example, relate new research findings to things that your audience might be familiar with – previous research, industry news, etc.
Lesson #3: You’re more interesting when you’re moving.
Starting to wonder if I spent any time in the ocean? Well yes, we went on a snorkel trip to Molokini. We saw all sorts of coral and fish.


On the way back to Maui, some dolphins started swimming around our boat. The captain stopped and the dolphins came to check us out. They played a bit, and then started swimming away. When the boat started moving again, the dolphins were immediately back, in front of the bow, and racing the boat – we were much more interesting when we were moving.

Takeaway: MOVE on your findings. At Sentient, we are always customizing and finding creative and actionable ways to interpret and present research that allows our clients to:
- Know the why behind the what
- Easily distribute market intelligence throughout the organization
- Take action and build consensus based upon market research
- Have complete confidence in the analytics and validity of implications
Friday, August 13, 2010
Ideas On Usability Presentations
So, this could be considered a lazy blog post - a blog post about another blog post. And, this other blog post is about other posts and presentations on usability, so this could be considered extremely lazy on my part.
However, click here for the Useful Usability blog and get links to 5 Radical Ideas From Usability Presentations. There is stuff in here for UX professionals, iPhone developers and tips on presenting research findings. All good stuff.Share it this post around and let us know what radical ideas you have for presenting usability research.
Here is a quick link to the first presentation covered:
Wednesday, July 14, 2010
The Power of Mobile Market Research
As advertising to the public via mobile phones becomes more widespread, it will be interesting to see what the future holds for other marketing activities – including market research. Market research will need to keep pace with location-based marketing services like FourSquare, wantANDfound, Gowalla, Loopt, Whrrl, Placecast and many others. Emerging as the latest medium for reaching consumers, how can mobile research technologies be utilized to gain deeper and richer insights into behavior and drive innovation? Think about it, what if customers could give feedback anytime, anywhere to improve products and services – right when the issue happens or the idea arises!
A relatively new tool we have come across is QualAnywhere from 20/20 Research, Inc. QualAnywhere allows you to build panels or do one-off recruiting and then interact with respondent via their mobile phone for surveys or qualitative chat. A few examples 20/20 Research gives as ways to utilize this methodology includes:
• Conducting studies about eating habits DURING the lunch hour
• Conducting studies on shopping WHILE participants are likely to be at the grocery store
Interacting with respondents at the POD (Point-Of-Decision) is a rarity, but when available adds to the research validity and actionability. How do you conduct research at the POD? I would love to hear about it and how it helped your research.
Friday, June 18, 2010
New ways to "research"
While it may not be “classic market research,” social media is bringing new ways for businesses to connect with customers for communication and feedback.
Interesting case in point – I was eating dinner at Tarka Indian Kitchen last night, and I saw that they had a well placed call to action to facilitate feedback from customers.
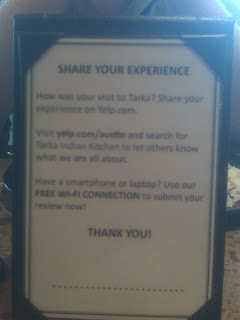 As my camera phone lacks the focus of an SLR camera, what you are looking at is a table tent that is found on each table. On one side is the wine list, and on the side we’re looking at is an invitation to “Share Your Experience” by reviewing them on Yelp. The final paragraph invites customers to submit their review immediately using Tarka’s free Wi-Fi connection.
With this open-ended approach Tarka is accomplishing several things:
A tool we use to gain a topical level of understanding when looking at focus group data and other unstructured text is wordle.net. With it we create word clouds where more frequently used words are displayed in larger font sizes and less frequently used words are displayed in smaller font sizes. We have used this successfully to showcase brand attributes, political campaigns and many other areas. This can help identify broad perceptions and opinions people may have. Below is the resulting word cloud when we feed Tarka’s Yelp reviews through it (note this is just a quick rundown – it has not been cleaned or edited of “nonsense” words such as conjunctions).

Interesting case in point – I was eating dinner at Tarka Indian Kitchen last night, and I saw that they had a well placed call to action to facilitate feedback from customers.
 As my camera phone lacks the focus of an SLR camera, what you are looking at is a table tent that is found on each table. On one side is the wine list, and on the side we’re looking at is an invitation to “Share Your Experience” by reviewing them on Yelp. The final paragraph invites customers to submit their review immediately using Tarka’s free Wi-Fi connection.
With this open-ended approach Tarka is accomplishing several things:
- Driving user-generated content about their restaurant by encouraging reviews
- Gathering unstructured feedback from customers
- Advertising that they have free Wi-Fi
- Gathering point-of-purchase feedback from those that login at their table using their smartphone or laptop
A tool we use to gain a topical level of understanding when looking at focus group data and other unstructured text is wordle.net. With it we create word clouds where more frequently used words are displayed in larger font sizes and less frequently used words are displayed in smaller font sizes. We have used this successfully to showcase brand attributes, political campaigns and many other areas. This can help identify broad perceptions and opinions people may have. Below is the resulting word cloud when we feed Tarka’s Yelp reviews through it (note this is just a quick rundown – it has not been cleaned or edited of “nonsense” words such as conjunctions).

Friday, April 23, 2010
User Research Technologies
Earlier this month the Austin chapter of the Usability Professionals’ Association hosted a panel on user research technologies. One of the attendees, Erin Lynn Young, posted some excellent notes about the evening here. 
Morae, Uservue, Silverback, Clicktale, VMWare and WebEx were the main technologies covered; however, the open discussion surfaced many other technologies as well – such as TreeJack from OptimalWorkshop and Grupthink for capturing open-ended responses.
Morae is our tool of choice for lab-based usability testing here at Sentient. It is actually a suite of products with Recorder, Observer and Manager.
- Recorder – used to record the actual test sessions – is simple to set up, transparent during the actual session and allows for “markers” to be inserted into the recording via quick key shortcuts.
- Observer – used to stream test session live – is easy to connect to Recorder for streaming and allows an observer to insert “markers” into the recording as well.
- Manager – used on the backend for analysis – has robust editing capabilities allowing you to create a story board with analytics and video clips
When we are doing eye tracking in a study (another tool in our user experience arsenal), we use Tobii Studio. It has many of the same capabilities of Morae and adds the additional layer of eye tracking. In analysis, we can create heatmaps (an aggregate image across all participants that represents the eye gaze data of all users viewing a given page) and gaze timelines (an image indicating the path of one user’s eye gaze for the during of each page, view or visual stimulus.
What tools and technologies have you used or come across?
Friday, January 8, 2010
Eye Tracking Web Usabilty - Jakob Nielson + Kara Pernice
So, while putting off a late night report review I came across Cennydd Bowles UK blog reviewing the new eye tracking book - Eye Tracking Web Usability. The bottom line review of the book - not a great read and not a great case for eye tracking (even though that is the express purpose of the book). I beg to respectfully disagree - my response here.
Let me know your thoughts, would love to continue the discussion.
Monday, September 21, 2009
Social Media and Market Research
Earlier this month Brad Bortner posed this question in The Forrester Blog For B2B Market Research Professionals:
What are your thoughts on MROCs? What other evolutions do you foresee in the research industry?
"Are MROCs [Market Research Online Communities] the next big thing in market research, and will they eventually take measurable share from traditional qualitative research?"Sentient Services has been working in online qualitative for a few years now through asynchronous bulletin board focus groups. While you give up a lot in moving away from a face-to-face interaction (body language, vocal intonation, etc.), in an asynchronous online group you have a lot of different strengths.
- Less time restraint – respondents have more time to think, they can look up notes and do “homework” assignments. Additionally, we can let side conversations go and see if the tangent provides additional insight
- Broader coverage – asynchronous participation means that respondents aren’t locked into 6-8pm ET, making time zones a non-issue. This translates to breaking down some geographic boundaries.
- Bigger groups – we’re not limited to the capacity of a conference room, meaning that we “seat” at least 12 participants per group (vs. 6-8 participants in a traditional group).
What are your thoughts on MROCs? What other evolutions do you foresee in the research industry?
Friday, September 18, 2009
Sentient Services (Ubiquity Marketing Un Summit 2009) V1
Presentation from Paul Janowitz (Founder, Sentient Services) at the 2009 Ubiquity Marketing unSummit.
Covers the current state of research in a customer driven web2.0 world. Contains tips and resources for entrepreneurs to leverage free and inexpensive market research techniques.
Covers the current state of research in a customer driven web2.0 world. Contains tips and resources for entrepreneurs to leverage free and inexpensive market research techniques.
Friday, February 13, 2009
Google and Eye-Tracking
A post from the Official Google Blog caught my eye last week: Eye-tracking Studies: more than meets the eye.
As Google points out, most people are not conscious of their eye movement, especially when doing something as mundane as a web search. Eye-tracking data lets you identify which elements of a webpage (or other stimulus) are viewed, and in what order. Just as importantly, you can identify elements that are not viewed - which may be the reason why task completion, ad recall or messaging breaks down.
In my opinion, eye-tracking is most powerful when it is combined with traditional think-aloud usability protocol. At Sentient, we do this with a little bit of a twist - first we start by allowing the user to complete a series of tasks without interruption from us to capture task completion and eye-tracking data without interference from trying to hold a conversation as well. Then we have the user walk us through what they were thinking and doing in a qualitative debrief.
By delving into a qualitative debrief after a user completes a task while their eyes are tracked we can learn the why behind what they did. For example:
By adding eye-tracking to the usability arsenal, you get a rich interaction between the quantitative eye-tracking metrics and the qualitative insights derived from traditional usability methods.
As Google points out, most people are not conscious of their eye movement, especially when doing something as mundane as a web search. Eye-tracking data lets you identify which elements of a webpage (or other stimulus) are viewed, and in what order. Just as importantly, you can identify elements that are not viewed - which may be the reason why task completion, ad recall or messaging breaks down.
In my opinion, eye-tracking is most powerful when it is combined with traditional think-aloud usability protocol. At Sentient, we do this with a little bit of a twist - first we start by allowing the user to complete a series of tasks without interruption from us to capture task completion and eye-tracking data without interference from trying to hold a conversation as well. Then we have the user walk us through what they were thinking and doing in a qualitative debrief.
By delving into a qualitative debrief after a user completes a task while their eyes are tracked we can learn the why behind what they did. For example:
- Did they linger on an element because it intrigued them or confused them?
- Why did they look at one navigation element, but then move to other navigation elements and click on them?
By adding eye-tracking to the usability arsenal, you get a rich interaction between the quantitative eye-tracking metrics and the qualitative insights derived from traditional usability methods.
Thursday, January 8, 2009
Stats, Media and a new book
I was listening to XM Public Radio with Bod Edwards this morning and heard a fascinating interview with Joel Best. Joel is a professor at the University of Deleware and just published a book titled "Stat-Spotting: A Field Guide to Identifying Dubious Data". A timely book if there ever was one - on the heels of an election with data thrown everywhere, financial markets that are either melting down or poised to rebound right about now depending upon the numbers you read that day and of course all of the numbers released daily on growth/no growth by industry/sector and just about any other segment one might be interested in. And, of course, market research and all of our clients and colleagues that deal with data, its interpretation and implications.
The book is available on Amazon.com and here is the description from Amazon.com, that summarizes it nicely:
Are four million women really battered to death by their husbands or boyfriends each year? Does a young person commit suicide every thirteen minutes in the United States? Is methamphetamine our number one drug problem today? Alarming statistics bombard our daily lives, appearing in the news, on the Web, seemingly everywhere. But all too often, even the most respected publications present numbers that are miscalculated, misinterpreted, hyped, or simply misleading. Following on the heels of his highly acclaimed Damned Lies and Statistics and More Damned Lies and Statistics, Joel Best now offers this practical field guide to help everyone identify questionable statistics. Entertaining, informative, and concise, Stat-Spotting is essential reading for people who want to be more savvy and critical consumers of news and information.

Happy New Year!
Monday, December 1, 2008
Usability Survival Kit - Be prepared
We all know the scout motto: be prepared. And having grown up in Girl Scouts, I like to think that I stay prepared for whatever life might send my way. For example, when traveling to conduct usability sessions, I always drag a copy of the project folder from the server to the local drive on my laptop. I also bring hard copies of critical documents for the study.
However, during usability sessions last month, life threw me a curveball I wasn’t ready for: The power went out to the entire building. There were no lights. No microphones. No recording. My laptop had limited battery supply, and there was no internet because the routers had no power.
Luckily this happened on the first day of a two day study, and we were able to reschedule the remaining participants for the next day. We had a marathon second day, but we successfully completed our study.
Having gone through this experience, I’ve compiled a “survival kit” for usability sessions that should get you through a power outage.
What about you? What unexpected events have you encountered while doing research? How did you cope with them or resolve them?
However, during usability sessions last month, life threw me a curveball I wasn’t ready for: The power went out to the entire building. There were no lights. No microphones. No recording. My laptop had limited battery supply, and there was no internet because the routers had no power.
Luckily this happened on the first day of a two day study, and we were able to reschedule the remaining participants for the next day. We had a marathon second day, but we successfully completed our study.
Having gone through this experience, I’ve compiled a “survival kit” for usability sessions that should get you through a power outage.
- Mobile broadband card – plug it into your computer, and you have internet access
- Portable power supply – power your computer through the rest of the sessions
- Digital audio recorder – hit record and capture the conversation from the session
What about you? What unexpected events have you encountered while doing research? How did you cope with them or resolve them?
Tuesday, September 2, 2008
CPC - CPM - CP?
More money is being spent online, serving up ads and an ad revenue model continue to be the driving force behind new start-ups, Microsoft purchases (or planned ones) and Google product development such as the new browser Chrome - built to further deliver targetting for those that buy via Google and potentially shut out others like Microsoft from lucrative profiling data The big question becomes how do you measure such terms as "immersion", "product placement", "gaming", "social media" and so forth.
One interesting idea we came up with at Sentient was in regards to measuring brand interaction in virtual worlds for market research (at the bottom of this post). How are you measuring brand interaction on emerging platforms?
Virtual Worlds activity is measured with specific metrics that are different from web metrics
These are the areas it makes most sense to measure:
– Sim Traffic
Sim = server
Sim traffic is the total amount of users that have visited the respective presence in a given time frame
Currently virtual worlds can accommodate 65-100 users per sim
– Concurrency
Average number of users on a sim at the same time
– Sustainability
Average time experience per user (in hours)
– Experiential Value (EV)
((Total Traffic/(Concurrency/10))*Sustainability= VE ratio
Benchmark - WBHV, 12/12/06 launch - ((200/(40/10))*40 = 533.33
– WBHV Rave Party was considered a success by Second Life standards
Tuesday, May 20, 2008
Austin is where the digitally savvy things are
That’s from a Scarborough Research report, which found that Austin has the highest concentration of consumers that own certain high tech items (such as DVRs, satellite radio, VoIP), engage in certain internet behaviors (including blogging, downloading music, online gaming) and use leading-edge cell phone features (email, text messaging, etc.). Scarborough Research terms these consumers the digitally savvy, and nationally, 6% of the population is classified as digitally savvy. While Austin boasts 12% of its population as being digitally savvy. Yet another reason why Austin is the coolest place to live! (Ok, perhaps I’m slightly biased as I call Austin home…)
As both the report and this recent article in Ad Age point out, the digitally savvy are leading edge digital consumers. Historically, this demographic has provided marketers a glimpse into the future in terms of cell phone and third screen behaviors. These behaviors are what enable the lifestyle of the digitally savvy – they are entrepreneurs and business decision makers that tend to have a longer commute, plus they like to travel. Thus they seem to prefer to “pull” information at their convenience instead of having it “pushed” to them. For example, they are more likely than the general population to download TV and video programs online.
The digitally savvy make an ideal target for a variety of market research engagements since they are more likely to be heavy and diverse online spenders, entrepreneurial, business decision makers and hungry for information (among other things).
- Ethnography could be used to further define how and from where this demographic pulls their information and to discover how a relationship model of advertising might be incorporated into the digitally savvy’s daily habits.
- Usability tests, especially on e-commerce sites, could yield tweaks to your site that greatly improve conversion rates. The digitally savvy, through their own tendencies, will have explored many sites and thus have developed a sense of best-of-breed on which they base their expectations of where certain parts of a site to be.
- Ideation would also be a great way to harness the strengths of the digitally savvy. Their entrepreneurship and hunger for information point to creative thinking processes that are just waiting to be tapped.
I am interested in hearing your thoughts – how else can we tap the digitally savvy? And let us know if you want to take a trip to Austin to visit the digitally savvy in person.
Monday, October 15, 2007
Virtual Worlds Expo: Wrap-Up
Back home now, with the luxury of a little time to think about it, these are my main takeaways from Virtual Worlds Expo:
Interoperability/open standards: Everyone was talking about this, in all it's iterations:
* A shift from "walled gardens" to interoperability, which could mean the ability to move your avatar and/or identity from one world to another, from a virtual world to a traditional website and back again, from virtual world to mobile phone and back
* Making virtual worlds work like the Web
* Having a common client for virtual worlds
* Having greater accessibility to your online and in-world friends from any world, site, or phone
Measurement and research:
Who's there? What drives them? What keeps them coming back? There was a lot of discussion about the "early adopters" in virtual worlds, although to mind this is wrong -- the early adopter are just *now* getting there. According to the original Everett Rogers adoption curve, it's the Innovators who are currently best represented in virtual worlds populations.
Some thought-provoking numbers were put forward by those on the Demographics panel:
* Michael Cai from Parks Research had numbers (from a 9,500 user study) on what people do less of in the real world while they participate in virtual worlds. The runaway winner was "don't watch as much TV" with 60% -- implications for advertising and brands are very clear there. The number I found thought-provoking as well as amusing was "16% don't know what they do less of" which seems to indicate that a pretty large percentage of people just don't really know how they spend their time!
* Mary Ellen Gordon of Market Truths had some interesting research results (though from a small sample) that indicate Second Life is a good place for a brand, if done right: 57% of respondents considered buying a real-life product as a result of a recommendation they received from someone in Second Life (which actually speaks as much to the power of word of mouth as it does to the value of using Second Life as a marketing and branding platform). Additionally, her research showed that:
55% recommended a real-life product to someone they were chatting to in Second Life.
25% have gone to look at a product in real life after seeing it in Second Life.
9% have purchased a product in real life after seeing it in Second Life.
8% have bought a real-life product in Second Life.
Segmentation (or not) between entertainment and "serious" purposes
Across a number of different panels, but particularly in the Community and Customer Service panel, there was discussion of just what it is that "drives" virtual worlds, that makes them so compelling. The aggregate answer seems to be that virtual worlds' growth is fueled by community and narrative (or story). This would seem to suggest what at least panelist Raph Koster of Areae said out loud, which is that there is no real differentiation in virtual worlds between entertainment and "serious purposes". This is actually also true in the non-virtual world as well, but the virtual world, like gaming, is perhaps the first platform that started out that way.
To read all Awareness Is Everything posts on the Virtual World Expo, go here.
This link goes to a Virtual Worlds News wrap-up post that links out to a ton of conference coverage, including ours.
Wednesday, October 10, 2007
Demographics in virtual worlds: Numbers and charts and predictions, oh my!
I've stayed with the Community track at the Virtual Worlds Expo. The featured morning panel on that track was "Demographics and Numbers: Where Things Are Heading".
First up was Nic Mitham, managing director of K-Zero. He forecasts growth for virtual worlds. One big reason -- the number of kid-based groups. Pretty soon children will be outgrowing the kids' worlds, and they will look for new worlds to get into. There's a huge marketplace already of children using virtual worlds who will migrate up the food chain as they grow older.
Said Mitham, growth in virtual worlds will come from Western Europe, from Russia, Eastern Europe, South America, and Asia. He said he doesn't yet see much virtual worlds activity for and from "silver surfers" or Baby Boomers. He said he also feels that corporate communities are prime for growth in virtual worlds, as is the educational space.
Mitham said the most exciting area for him was product development -- new virtual worlds, and new interfaces, that he feels will help grow the overall virtual worlds space. He says the typical profile of today's virtual worlds user is an early adopter (though I actually think this is wrong -- we're just now getting early adopters in virtual worlds. According to the original Everett Rogers adoption curve, it's the Innovators who are currently best represented in virtual worlds populations).
Mitham said easier interfaces will trigger growth for early adopters, and serve as a bridge to get new people into virtual worlds. One thing that will engage people is to make the overall experience easier. Also helping will be Web-based remote viewers, using a browser to access virtual worlds, including mobile devices. New worlds will help growth as well. A Google My World would be a huge source of growth.
Mitham also sai that diversification would be helpful in growing overall vw user numbers. He cited the rise of category-centric vertical worlds such as Football Superstars (currently in development). There's potential for growth in community-based worlds where the draw is the content, not just "early adopters" (or Innovators!) looking for the next new thing. Finally he cited cross-world avatars as having the potential to grow the total population, though not the number of unique users. But cross-world avatars could help more people get engaged in vws.
Mitham put forward some growth projections for the period Q407 to Q408 in selected virtual worlds. These are increases in the numbers of registered accounts, where the first number is the Q407 number of registered accounts and the second number is Mitham's prediction of the number of registered accounts for Q408:
Second Life 10m to 20m; There.com 1 m to 7 m, Kaneva 0.6m to 3m, HiPiHi 0m to 10m, Whyville 3m to 10m, Club Penguin 15m to 30m, Football Superstars 0m to 3m
Next up was Parks Associates' Michael Cai, who put forward numbers form a recent Parks survey:
6% of US broadband users visit virtual worlds on a weekly basis.
18% have tried a virtual world at least once.
Second Life is the number 1 virtual worlds, followed by teen worlds and kid worlds. Most regular virtual worlds users visit more than virtual world.
He also had numbers on virtual worlds vs social networks -- he reported huge gaps betwen social network and virtual worlds usage among various demographics. Such as -- 40% of 25- to 34-year-olds participate in social networks, vs 12% of that age group participating in virtual worlds; 71% of 18- to 24-year-olds participate in social networks, vs 10% of hat age group participating in virtual worlds; 35% of females participate in social networks vs 5% females participating in virtual worlds; and 29% of males participate in social networks vs 7% of males participating in virtual worlds.
Cai also had numbers (from a 9,500 user study) on what people do less of in the real world while they participate in virtual worlds:
60% don't watch as much TV
22% don't sleep as much
18% don't read as much
16% don't know what they do less of (I found that illuminating -- people just don't really know how they spend their time!)
15% work less
15% spend less time with friends and family
12% don't do sports as much
11% don't shop as much
7% other
Finally, Cai said the majority of users think Second Life is a good medium to promote a brand or product
Last up was Market Truths' Mary Ellen Gordon, who presented an update of research whose first wave was done in the first quarter of this year (n=201 Second Life users in Q! and 190 SL users in Q3, after excluding questionable respondents)
60% of respondents have positive perceptions of real-life brands in Second Life, which is an improvement over the Q1 numbers.
Between quarters, the perceptions of brand effects and consequences hasn't changed. Brands bringing in new resources to virtual worlds are considered a good thing, and people are not as afraid that real-life brands will damage small content creators in Second Life.
Gordon said that as the Second Life population has grown, some concerns abotu brands "taking over" Second Life are still there, but the new people coming in too SL now are more mainstream and don't have as many concerns.
Here are the tactics Gordon's research says work best for brands in Second Life:
Give away SL versions of real-life products; co-create real-life products; sponsor brand-related events; customize real-life products for SL use. People tend to like things that link Second Life and real life, that offer two-way interactions.
What doesn't work: advertising via IM in-world; advertising using notecards for neutrally perceived brands (brands that are not already high-profile in Second Life). Most tactics are perceived more positively when undertaken by brands for which pre-existing attitudes are positive.
Gordon also presented numbers on consumer behavior in and out of Second Life:
57% considered buying a real-life product as a result of a recommendation they received from someone in Second Life.
55% recommended a real-life product to someone they were chatting to in Second Life.
25% have gone to look at a product in real life after seeing it in Second Life.
9% have purchased a product in real life after seeing it in Second Life.
8% have bought a real-life product in Second Life.
Gordon's research on brand types: High-awareness brands in Second Life are currently concentrated in five categories: Of 24 brands meantioned unaided, they were concentrated in information technology, athletic shoes, soft drinks, cars, and media
Gordon said that given the word-of-mouth numbers form her research, it's important for brands to start looking at soft measures as well as metrics -- measures such as word of mouth, engaging with the brand/product in real life, in-world effects vs real world effects vs cross-channel effects, and buying process.
Both active and passive measures have issues in terms of user acceptability. People in focus groups have said they value their privacy and don't really want to be tracked in Second Life as closely as is now possible, let alone will be possible in future.
Finally, Gordon said that some of the brands with the highest awareness do not have an official presence, but their awareness is the result of people making unofficial versions of their products available in Second Life. There's a concern among brand people about whether or not these products represent their brands as they would like. Brands need to work with small content creators in a way that works for the brand yet doesn't cause a backlash.
Questions from the floor:
What's the most underserved demographic in virtual worlds? Mid-40s and up, said KZero's Mitham, although he doesn't know whether the demand is there yet. He said, we know these people are active web and email users. Cai from Parks said the social networking crowd isn't well-served yet, and he doesn't understand why match.com and such sites haven't been in virtual worlds yet. He also said females are underserved.
How many virtual world users are there today worldwide, and projections through 2011? If someone knows the answer to that, I'd ask them to buy my lottery ticket, said Mitham.
Virtual World Guide white paper available for free download
We've compiled a guide to existing virtual worlds that's available for free download. This guide offers info and screen shots on dozens of worlds from Second Life to Habbo Hotel. There's also more information in the paper about our Virtual Awareness research offering, designed to help companies understand more about how, when, and where to take their brand into virtual worlds.
To get a free copy of Sentient's Guide to Virtual Worlds, go here..
To get a free copy of Sentient's Guide to Virtual Worlds, go here..
Thursday, October 4, 2007
User research for Second Life, virtual worlds in general
As of yet there's not a whole lot of research available publicly on the user experience in Second Life and virtual worlds overall. That's starting to change. Just this week a couple of reports have crossed my desk, one free and the other relatively inexpensive. Both are thought-provoking.
User Acceptance of Virtual Worlds bills itself as an "exploratory report" and with 250 respondents, that seems right. It's also fairly timely, having been fielded last spring. The authors, academics at Rollins College and Potsdam University, present this summary of their findings, a sort of snapshot of their respondents:
The reason I found this interesting was that I read this report just after I read Social Technographics, a Forrester report from last spring that attempt to segment consumers of all kinds of social media, describing them by their placement on the "participation ladder" (see image here, in a thoughtful blog post on the Business Communicators of Second Life blog that discusses the Social Technographics report in detail).
According to report author Charlene Li, the ladder represents "six increasing levels of a participation in social technologies. Participation at one level may or may not overlap with participation at other levels." The six rungs are (in descending order of intensity of participation):
These studies are interesting for the snapshots they offer, but overall there is a dearth of research available on virtual worlds users -- what motivates them, what interests them, who they are, what their real-life and virtual-worlds habits are, how those are different and how those are similar.
There's a move afoot to start a Metaverse Market Index, which will offer an independent, welcome source for tracking data and for virtual worlds user research. Once the MMI gets started, the virtual worlds world will be less like the Wild West and more like....the Wild West with a couple of badged sheriffs, maybe. Data should begin to come from that effort by mid-2008.
Meanwhile, companies that would like to explore the possibilities of virtual worlds for their brands would be advised to do primary research specifically tailored to their brand (both in-world and real-life). Call us if you need help with that. That we can do!
User Acceptance of Virtual Worlds bills itself as an "exploratory report" and with 250 respondents, that seems right. It's also fairly timely, having been fielded last spring. The authors, academics at Rollins College and Potsdam University, present this summary of their findings, a sort of snapshot of their respondents:
· 90% of respondents have less than a year experience on Second Life.The authors also asked their respondents what other social networks they are on, and got this response: 72% also use YouTube, 47% use Flickr, 40% use MySpace, 39% use FaceBook and 33% use LinkedIn.
· 70% access Second Life from home.
· 67% of respondents are not afraid of giving personal information.
· Almost 60% are very likely to buy virtual goods from Second Life, and 42% are willing to use their credit card.
· 70% perceive Second Life to improve collaboration, 69% say it improves communication, and 61% say it improves cooperation between people.
· 56% of respondents perceive Second Life as easy to use.
· Finally, people are using Second Life not to change their identity, but rather to explore and visit new places and meet people.
The reason I found this interesting was that I read this report just after I read Social Technographics, a Forrester report from last spring that attempt to segment consumers of all kinds of social media, describing them by their placement on the "participation ladder" (see image here, in a thoughtful blog post on the Business Communicators of Second Life blog that discusses the Social Technographics report in detail).
According to report author Charlene Li, the ladder represents "six increasing levels of a participation in social technologies. Participation at one level may or may not overlap with participation at other levels." The six rungs are (in descending order of intensity of participation):
· Creators. Online consumers who publish blogs, maintain Web pages, or upload videos to sites like YouTube at least once per month. Creators, an elite group, include just 13% of the adult online population. Creators are generally young — the average age of adult users is 39 — but are evenly split between men and women.The way I am reading the results from these studies, Second Life is full of Creators and Joiners. The Social Technographics report also offers profile information on users with different kinds of motivations. Social media users who are entertainment-motivated (which would be many Second Life users) tend to "participate in greater numbers," says the report (as opposed to those whose use of social media is motivated by career or family). As more job fairs and other recruiting activities start to take place in Second Life, we may see greater numbers of career-motivated people there.
· Critics. These online consumers participate by commenting on blogs or posting ratings and reviews on sites like Amazon.com. Critics represent 19% of all adult online consumers and on average are several years older than Creators.
· Collectors. Users who save URLs on a social bookmarking service like del.icio.us or use RSS feeds on Bloglines, thus creating metadata that’s shared with the entire community. Collectors represent 15% of the adult online population and are the most male-dominated of all the Social Technographics groups.
· Joiners. This unique group has just one defining behavior — using a social networking site like MySpace.com or Facebook. They represent only 19% of the adult online population and are the youngest of the Social Technographics groups. They are highly likely to engage in other Social Computing activities — 56% also read blogs, while 30% publish blogs.
· Spectators. This group of blog readers, video viewers, and podcast listeners, which represents 33% of the adult online population, is important as the audience for the social content made by everyone else. The most common activity for Spectators is reading blogs.
· Inactives. Today, 52% of online adults do not participate at all in social computing activities. These Inactives have an average age of 50, are more likely to be women, and are much less likely to consider themselves leaders or tell their friends about products that interest them.
These studies are interesting for the snapshots they offer, but overall there is a dearth of research available on virtual worlds users -- what motivates them, what interests them, who they are, what their real-life and virtual-worlds habits are, how those are different and how those are similar.
There's a move afoot to start a Metaverse Market Index, which will offer an independent, welcome source for tracking data and for virtual worlds user research. Once the MMI gets started, the virtual worlds world will be less like the Wild West and more like....the Wild West with a couple of badged sheriffs, maybe
Meanwhile, companies that would like to explore the possibilities of virtual worlds for their brands would be advised to do primary research specifically tailored to their brand (both in-world and real-life). Call us if you need help with that. That we can do!
Subscribe to:
Posts (Atom)